A success rate is a percentile in disguise
A Monte Carlo simulation does something simple many times. It takes your plan, draws the things nobody can know in advance — market returns, inflation, how long you live — at random from assumed ranges, and works out what happens. Then it does it again, with new draws, a few thousand times. What comes out is not one answer but a spread of them.
A success rate is one way to squeeze that spread into a single number: the share of trials in which the plan passes some test you chose — often, that the money never runs out.
The catch is that the number carries three hidden choices:
- The test. Never runs out, never drops below a floor and leaves something behind are different tests and give different rates for the same plan.
- The assumptions. The average return, its volatility, the inflation range and the lifespan table decide what the trials look like.
- The model. What it randomizes, what it holds fixed, and what it leaves out entirely.
A rate of 9 in 10 is the same statement as a 10th percentile. It says that in one trial out of ten, the outcome was worse than the line you drew. It does not say your personal odds are 90%; it says 90% of the simulated lifetimes, built from those assumptions, cleared the bar.
Worked example (illustrative numbers). Suppose a simulation runs 2,000 trials and the plan's money lasts for life in 1,700 of them.
- Success rate: 1,700 ÷ 2,000 = 85%.
- Put the 2,000 results in order from worst to best. The 10th percentile is the 200th-worst result. If it fails the test, at least 200 trials failed, so the success rate is 90% at most — and here it is 85%.
- Change one assumption — a lower average return — and the same plan might pass in 1,500 trials: 75%. The plan did not change. The inputs did.
Why the order of returns matters
If you never add or withdraw money, the order of your yearly returns does not matter: multiplying the same growth factors in a different order gives the same result. Once you are withdrawing, order matters a lot. A loss early in retirement shrinks the balance your later gains have to work on, and the money you already withdrew cannot recover.
This is why a simulation draws a new return for every year of every trial rather than applying one average: the same long-run average can arrive in a kind order or a cruel one.
Worked example (illustrative balance and withdrawal; real TSP C Fund returns). Start with $100,000, withdraw $6,000 at the start of each year, and apply three published C Fund calendar-year returns: 2008 (−36.99%), 2009 (+26.68%) and 2010 (+15.06%).
| Year | Loss first (2008, 2009, 2010) | Loss last (2010, 2009, 2008) |
|---|---|---|
| 1 | $59,229.40 | $108,156.40 |
| 2 | $67,431.00 | $129,411.73 |
| 3 | $70,682.51 | $77,761.73 |
Same three returns, same withdrawals — about $7,079 apart after three years, purely because of the order. With no withdrawals, both orders end at $91,842.12.
What an inflation-adjusted pension changes
A simulation built around a portfolio alone misses the biggest fact about a military retirement: retired pay is adjusted for inflation by statute. That changes what the simulation is really about.
- The general rule, §1401a(b)(2): the Secretary shall “increase the retired pay of each member and former member by the percent (adjusted to the nearest one-tenth of 1 percent) by which” the price index for the year's base quarter exceeds the base index.
- Bonus electees (REDUX), §1401a(b)(3): for members who first became members on or after August 1, 1986 and elected the bonus under 37 U.S.C. §354 (or former §322), the increase is the (b)(2) percent minus 1 percent — and the reduction applies only “If the percent determined under paragraph (2) is greater than 1 percent”.
- Modernized retirement system (Blended Retirement System) participants, §1401a(b)(5): notwithstanding (b)(3), the Secretary shall “increase the retired pay of such member in accordance with paragraph (2)” — the full adjustment.
Two consequences for reading a simulation:
- A large share of your income is not exposed to the stock market at all. The pension's exposure is to inflation, and the statute ties its COLA to a price index. The portfolio's job shrinks to the gap the pension does not cover.
- Inflation is still worth randomizing, because it moves both the pension and what everything costs. The history is lumpy: in the Social Security COLA series from 2010 to 2026 — the series the Lifetime Monte Carlo draws its default COLA from — three years — 2010, 2011 and 2016 — paid no COLA, and 2023 paid 8.7%.
For the formula that sets the pension in the first place, see our retired pay calculation guide.
What TSP history actually says
TSP.gov publishes calendar-year returns. The C Fund, which tracks the S&P 500, has a series from 1988 — a partial first year — through 2025:
- Best year: 1995, +37.41%. Worst year: 2008, −36.99%.
- Down years: 7 of the 38 — 1990, 2000, 2001, 2002, 2008, 2018 and 2022.
- Simple average of the 38 annual returns: 12.7%, with a sample standard deviation of 17.1%.
The G Fund, which invests in short-term U.S. Treasury securities, looks nothing like it: its 1988–2025 returns range from 0.97% (2020) to 8.90% (1990), with no negative year in the series, a 4.6% average and a 2.3% standard deviation.
TSP.gov's 10-year average annual returns as of June 30, 2026: G Fund 2.89%, F Fund 1.63%, C Fund 15.47%, S Fund 12.63%, I Fund 10.76%. A ten-year window is one window; the full series above shows how different another decade can look.
Worked example (our arithmetic on the published C Fund series). The simple average of the 38 yearly returns is 12.7%. But money compounds: chaining all 38 returns together turns $1 into about $58.70, which is the same as earning about 11.3% every year.
The gap is volatility. A −36.99% year needs a gain of more than 58% just to get back to even, so the compound rate always sits below the simple average when returns swing. A simulation that draws returns around a 12.7% average will produce typical compound growth below 12.7%.
How long the plan has to last
The length of retirement is the uncertainty that is easiest to leave out. The Social Security Administration's 2023 period life table gives a death probability for each age from 0 to 119, separately for men and women. A few rows:
| Age | Men | Women |
|---|---|---|
| 60 | 0.011337 | 0.006923 |
| 70 | 0.022903 | 0.014769 |
| 80 | 0.055633 | 0.041183 |
| 90 | 0.159458 | 0.129176 |
| 119 | 0.926604 | 0.926604 |
The values are small in your sixties and climb steeply after that, and they are the same for men and women from age 109 up. Walking the table year by year is what turns a single life expectancy into a spread of possible lifespans — and the long tail of that spread is where plans fail.
Worked example (our arithmetic on the SSA 2023 table). Multiply the chance of surviving each year from 60 through 89:
- A 60-year-old man reaches 80 in about 60% of cases, and 90 in about 23%.
- A 60-year-old woman reaches 80 in about 71% of cases, and 90 in about 33%.
On this table, about one in three women and a little over one in five men who reach 60 are still alive at 90. A plan tested only to age 85 is not tested against those lives.
This is population-level mortality from one period, not a prediction for you — your health, your family history and future medical change all move it.
What the WheelsUp Lifetime Monte Carlo does
The Lifetime Monte Carlo is a Pro tool. It runs your remaining lifetime as a set of seeded trials — 2,000 by default — and sweeps them across your Retirement Pay scenarios, so each scenario's VA rating, SBP election and retirement system is compared on the same footing. In each trial it randomizes three things:
- Your age at death, and optionally your spouse's, drawn by walking the SSA 2023 period life table year by year — the two lifespans drawn independently.
- The annual return on your TSP balance, drawn from a C Fund preset (the 12.7% average and 17.1% deviation above, the default), a G Fund preset (4.6% and 2.3%), or your own figures. The TSP balance comes from a linked TSP Growth scenario.
- The annual COLA, drawn by default around the 2010–2026 Social Security COLA series' average of 2.3% with a 2.2% deviation, and never below zero.
Retired pay, VA compensation and SBP payments then follow from those draws. The results:
- Lifetime income as a range — the 10th, 50th and 90th percentiles — in raw dollars or in today's dollars.
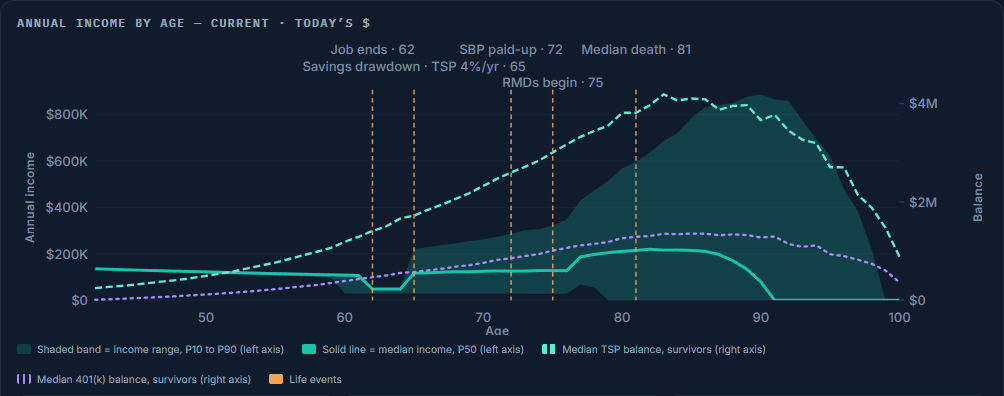
- Annual income by age, with the median line and the band the middle 80% of trials fall in, and the TSP balance on its own scale.
- The TSP balance left at death, reported separately rather than added to income.
- A plain-language lead when federal tax is switched on — in 9 of 10 trials this plan pays you at least a stated lifetime amount, and, where the data can show it, the age by which the TSP is empty in 1 of 10.
Federal tax is optional and includes the additional 10% charge on early withdrawals where you have not declared an exception. The same seed reproduces the same run, so a change you make is the only thing that moves the answer.
The Lifetime Monte Carlo shows the spread, not just the middle — thousands of simulated lifetimes across your own pay scenarios, with the range you are planning for drawn as a band you can read age by age.
What any model leaves out — including ours
Every simulation simplifies, and the useful ones say how. The Lifetime Monte Carlo lists its own omissions on screen. Among them:
- Draws are independent year to year. Real markets can trend or rebound; the model does not assume either.
- No link between returns and inflation, and none between your lifespan and your spouse's.
- State and local income tax are not modeled; nor are TRICARE and Medicare costs, or changes to a VA rating over time.
- A COLA never goes negative in the model, so in a deflation year the pension holds its nominal value — a small built-in advantage.
- Social Security is your own figure if you enter one; the model does not compute it from an earnings record, and it does not model a survivor benefit.
The general lesson holds for any tool: the assumptions do most of the work. Change the return assumption from the C Fund preset to the G Fund preset and the whole picture moves. Run both before you trust either.
The short checklist
- Ask what the test is before you read any success rate.
- Read the 10th percentile, not just the median — that is the outcome you are protecting against.
- Check the return and inflation assumptions, and run a cautious set alongside the default.
- Plan to a late age. The life table's tail is long.
- Remember what the pension covers. Your COLA rule — full or REDUX — shapes how much the portfolio has to do.
- Compare plans on the same seed, so the difference you see comes from the decision, not the dice.
Sources
- TSP.gov, Rates of Return — C Fund and G Fund calendar-year returns, 1988–2025 (C Fund 1988 a partial year), with the arithmetic means and sample standard deviations computed from those series
- TSP.gov, Rates of Return — 10-year average annual returns by fund as of June 30, 2026, and the fund descriptions
- Social Security Administration, Office of the Chief Actuary, Period Life Table, 2023 — male and female death probabilities by exact age, 0–119
- 10 U.S.C. §1401a — (b)(2) the percentage increase; (b)(3) the reduced increase for bonus electees, conditioned on (b)(2) exceeding 1 percent; (b)(5) the full increase for modernized-retirement-system participants
- CRS Report 94-803, Table 3 — Social Security COLA by year, 2010–2026, with the computed average and sample standard deviation
- 26 U.S.C. §72(t)(1) — the additional tax of 10 percent on the includible portion of an early distribution from a qualified retirement plan, which the simulator can charge
Spot an error? Tell us — citations are the product here.
Plan for the range, not the average. WheelsUp runs your own pay scenarios through thousands of simulated lifetimes and shows the spread — with the return, COLA and life-table assumptions cited, and the return and COLA figures yours to change.